
목차
- 개요
- PER: 주가 수준을 평가하는 지표
- 2.1 PER의 개념
- 2.2 PER의 활용 예시
- ROE: 기업의 수익성을 측정하는 핵심 지표
- 3.1 ROE의 개념
- 3.2 ROE의 해석과 활용
- PBR: 주가 대비 자본의 효율성을 보여주는 지표
- 4.1 PBR의 이해
- 4.2 PBR이 주는 신호와 예시
- 조합의 힘: PER, ROE, PBR의 상호작용
- 5.1 지표들 간의 관계
- 5.2 예시를 통한 기업가치 평가
1. 개요
주식 시장에서 투자 결정을 내리기 위해서는 정확한 기업가치 평가가 필수적입니다. 이를 위해 투자자들은 다양한 지표를 활용하는데, 그 중에서도 PER(주가수익비율), ROE(자기자본이익률), PBR(주가순자산비율)은 핵심적인 역할을 합니다. 이 칼럼에서는 이 세 가지 지표의 조합을 통한 기업가치 판단에 대해 살펴보겠습니다.
2. PER: 주가 수준을 평가하는 지표
2.1 PER의 개념
PER은 Price-to-Earnings Ratio의 약자로, 주가 대비 기업의 순이익을 나타내는 지표입니다. PER은 주식 시장에서 흔히 사용되며, 주가 수준을 판단하는데 도움을 줍니다.
2.2 PER의 활용 예시
예를 들어, 기업 A와 기업 B가 각각 PER이 15배와 10배일 때, 기업 B는 주당 이익 대비 낮은 가격에 거래되고 있으므로 투자자들에게 높은 매력을 띠게 됩니다.
3. ROE: 기업의 수익성을 측정하는 핵심 지표
3.1 ROE의 개념
ROE은 Return on Equity의 약자로, 기업의 자기자본에 대한 이익을 나타내는 지표입니다. ROE은 투자자가 기업의 수익성을 평가하는 데에 중요한 지표 중 하나입니다.
3.2 ROE의 해석과 활용
높은 ROE는 기업이 주주들의 투자를 효과적으로 활용하고 있다는 것을 나타냅니다. 투자자들은 높은 ROE를 가진 기업을 찾아내어 투자할 때 미래 수익성이 높을 것으로 기대할 수 있습니다.
4. PBR: 주가 대비 자본의 효율성을 보여주는 지표
4.1 PBR의 이해
PBR은 Price-to-Book Ratio의 약자로, 주가를 기업의 주당 순자산 가치로 나눈 비율을 나타냅니다. 이는 기업의 순자산 대비 주가의 상대적인 저평가 여부를 판단하는 데 사용됩니다.
4.2 PBR이 주는 신호와 예시
PBR이 1보다 낮다면 주가가 기업의 순자산 가치보다 낮다고 해석할 수 있습니다. 예를 들어, PBR이 0.8이라면 주가가 순자산 가치의 80%에 거래되고 있다는 의미입니다.
5. 조합의 힘: PER, ROE, PBR의 상호작용
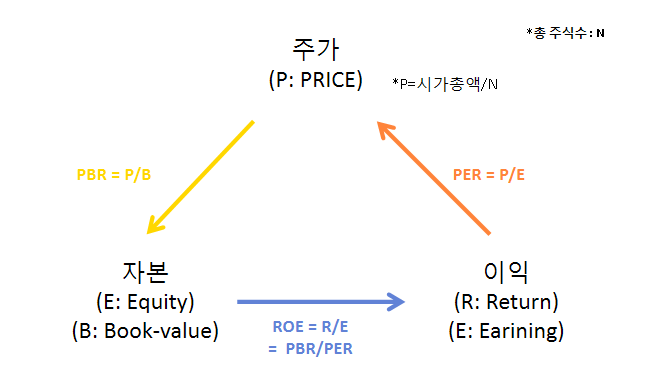
5.1 지표들 간의 관계
이 세 가지 지표는 서로 연관되어 기업의 종합적인 가치를 이해하는 데 도움을 줍니다. 예를 들어, PER이 낮으면서 ROE가 높고 PBR이 적절하다면 투자 가치가 있다고 볼 수 있습니다.
5.2 예시를 통한 기업가치 평가
만약 PER이 낮지만 ROE가 낮다면, 투자자는 자산의 효율성에 대해 더 깊게 살펴보아야 합니다. 이때 PBR을 확인하여 기업의 자본 구조와 효율성을 파악할 수 있습니다.
6. 결론
PER, ROE, PBR을 종합적으로 고려하면 투자자는 더 나은 투자 결정을 내릴 수 있습니다. 각 지표가 의미하는 바를 이해하고, 조합하여 활용하는 것이 효과적인 투자 전략을 만들어낼 수 있습니다. 주식 시장에서의 성공을 위해서는 꼼꼼한 분석과 신중한 판단이 필수이며, 이러한 과정을 거쳐 비로소 투자 성공의 문을 열 수 있을 것입니다.
Become a Stock Investment Expert: Evaluating Corporate Value with PER, ROE, and PBR Combination
Table of Contents
- Overview
- PER: Evaluating Price Levels
- 2.1 Concept of PER
- 2.2 Practical Examples of PER Utilization
- ROE: Key Metric for Assessing Profitability
- 3.1 Concept of ROE
- 3.2 Interpretation and Application of ROE
- PBR: Revealing Efficiency of Capital Relative to Stock Price
- 4.1 Understanding PBR
- 4.2 Signals and Examples of PBR
- Power of Combination: Interplay of PER, ROE, and PBR
- 5.1 Relationships Among Indicators
- 5.2 Assessing Corporate Value Through Examples
1. Overview
Making informed investment decisions in the stock market requires accurate evaluation of corporate value. Among the various metrics investors employ, PER (Price-to-Earnings Ratio), ROE (Return on Equity), and PBR (Price-to-Book Ratio) play pivotal roles. In this column, we will explore the assessment of corporate value through the combination of these three indicators.
2. PER: Evaluating Price Levels
2.1 Concept of PER
PER, or Price-to-Earnings Ratio, represents the ratio of a stock’s price to the company’s earnings. It is commonly used in the stock market to assess price levels.
2.2 Practical Examples of PER Utilization
For instance, if Company A and Company B have PERs of 15 and 10, respectively, Company B is perceived as trading at a lower price relative to its earnings, making it more appealing to investors.
3. ROE: Key Metric for Assessing Profitability
3.1 Concept of ROE
ROE, or Return on Equity, measures a company’s profitability by indicating how efficiently it generates earnings from shareholders’ equity.
3.2 Interpretation and Application of ROE
A high ROE suggests effective utilization of shareholders’ investments. Investors often seek companies with high ROE as it indicates potential for future profitability.
4. PBR: Revealing Efficiency of Capital Relative to Stock Price
4.1 Understanding PBR
PBR, or Price-to-Book Ratio, compares a stock’s price to its book value per share, revealing the relative undervaluation or overvaluation of the stock.
4.2 Signals and Examples of PBR
If PBR is below 1, it implies the stock is trading below its book value. For instance, a PBR of 0.8 indicates the stock is trading at 80% of its book value.
5. Power of Combination: Interplay of PER, ROE, and PBR
5.1 Relationships Among Indicators
These three indicators are interrelated, providing a comprehensive understanding of a company’s value. For example, a low PER, high ROE, and appropriate PBR may suggest an investment opportunity.
5.2 Assessing Corporate Value Through Examples
If PER is low but ROE is also low, investors should scrutinize the efficiency of assets. In such cases, examining PBR can provide insights into the company’s capital structure and efficiency.
6. Conclusion
By considering PER, ROE, and PBR together, investors can make better decisions. Understanding the meaning of each indicator and combining them strategically enhances the effectiveness of investment strategies. Success in the stock market requires meticulous analysis and careful judgment, and through this process, investors can open the door to investment success.